- Tools
- Downloads
- Links
- Community
- Species
- About
- Help
FB2024_02
,
released April 23, 2024

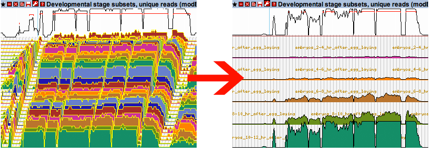
The standard FlyBase view of RNA-Seq coverage data in GBrowse provides a concise and global overview of the transcriptome. All sample data for a given set are shown on a log2 scale, with tight vertical layering of profiles and a slight horizontal offset between adjacent profiles (pictured left).
However, this compact layout hinders a more detailed assessment of signal in specific samples. With this in mind, FlyBase introduces new user-configurable display options for RNA-Seq profiles in GBrowse as part of the FB2014_06 update. By clicking on the small “wrench” icon in the track title bar (pictured left, under the “Configure this track” bubble), a pop-up configuration menu can be accessed that allows users to customize several aspects of the display.
1. Focus on just the samples of interest.
Select a subset of sample data - just hold down the control or shift button to select multiple samples.
For stranded RNA-Seq data, one can choose between plus or minus strand data.
2. Space the data out.
Increase the “vertical spacing” between samples to prevent strong signal
from one sample from obscuring the profile behind it.
3. Align the profiles.
Change the “Samples presentation style”
from “Tilted” (default) to “Vertical”
to remove the horizontal offset between adjacent RNA-Seq profiles
so that they align horizontally to the same genome position.
4. Choose the appropriate scaling method.
Log2 scaling provides the best dynamic range for viewing both low and high signal together.
Linear scaling1 is preferable in regions with high baseline signal,
and provides a more intuitive view of the relative change in signal.