- Tools
- Downloads
- Links
- Community
- Species
- About
- Help
FB2024_02
,
released April 23, 2024
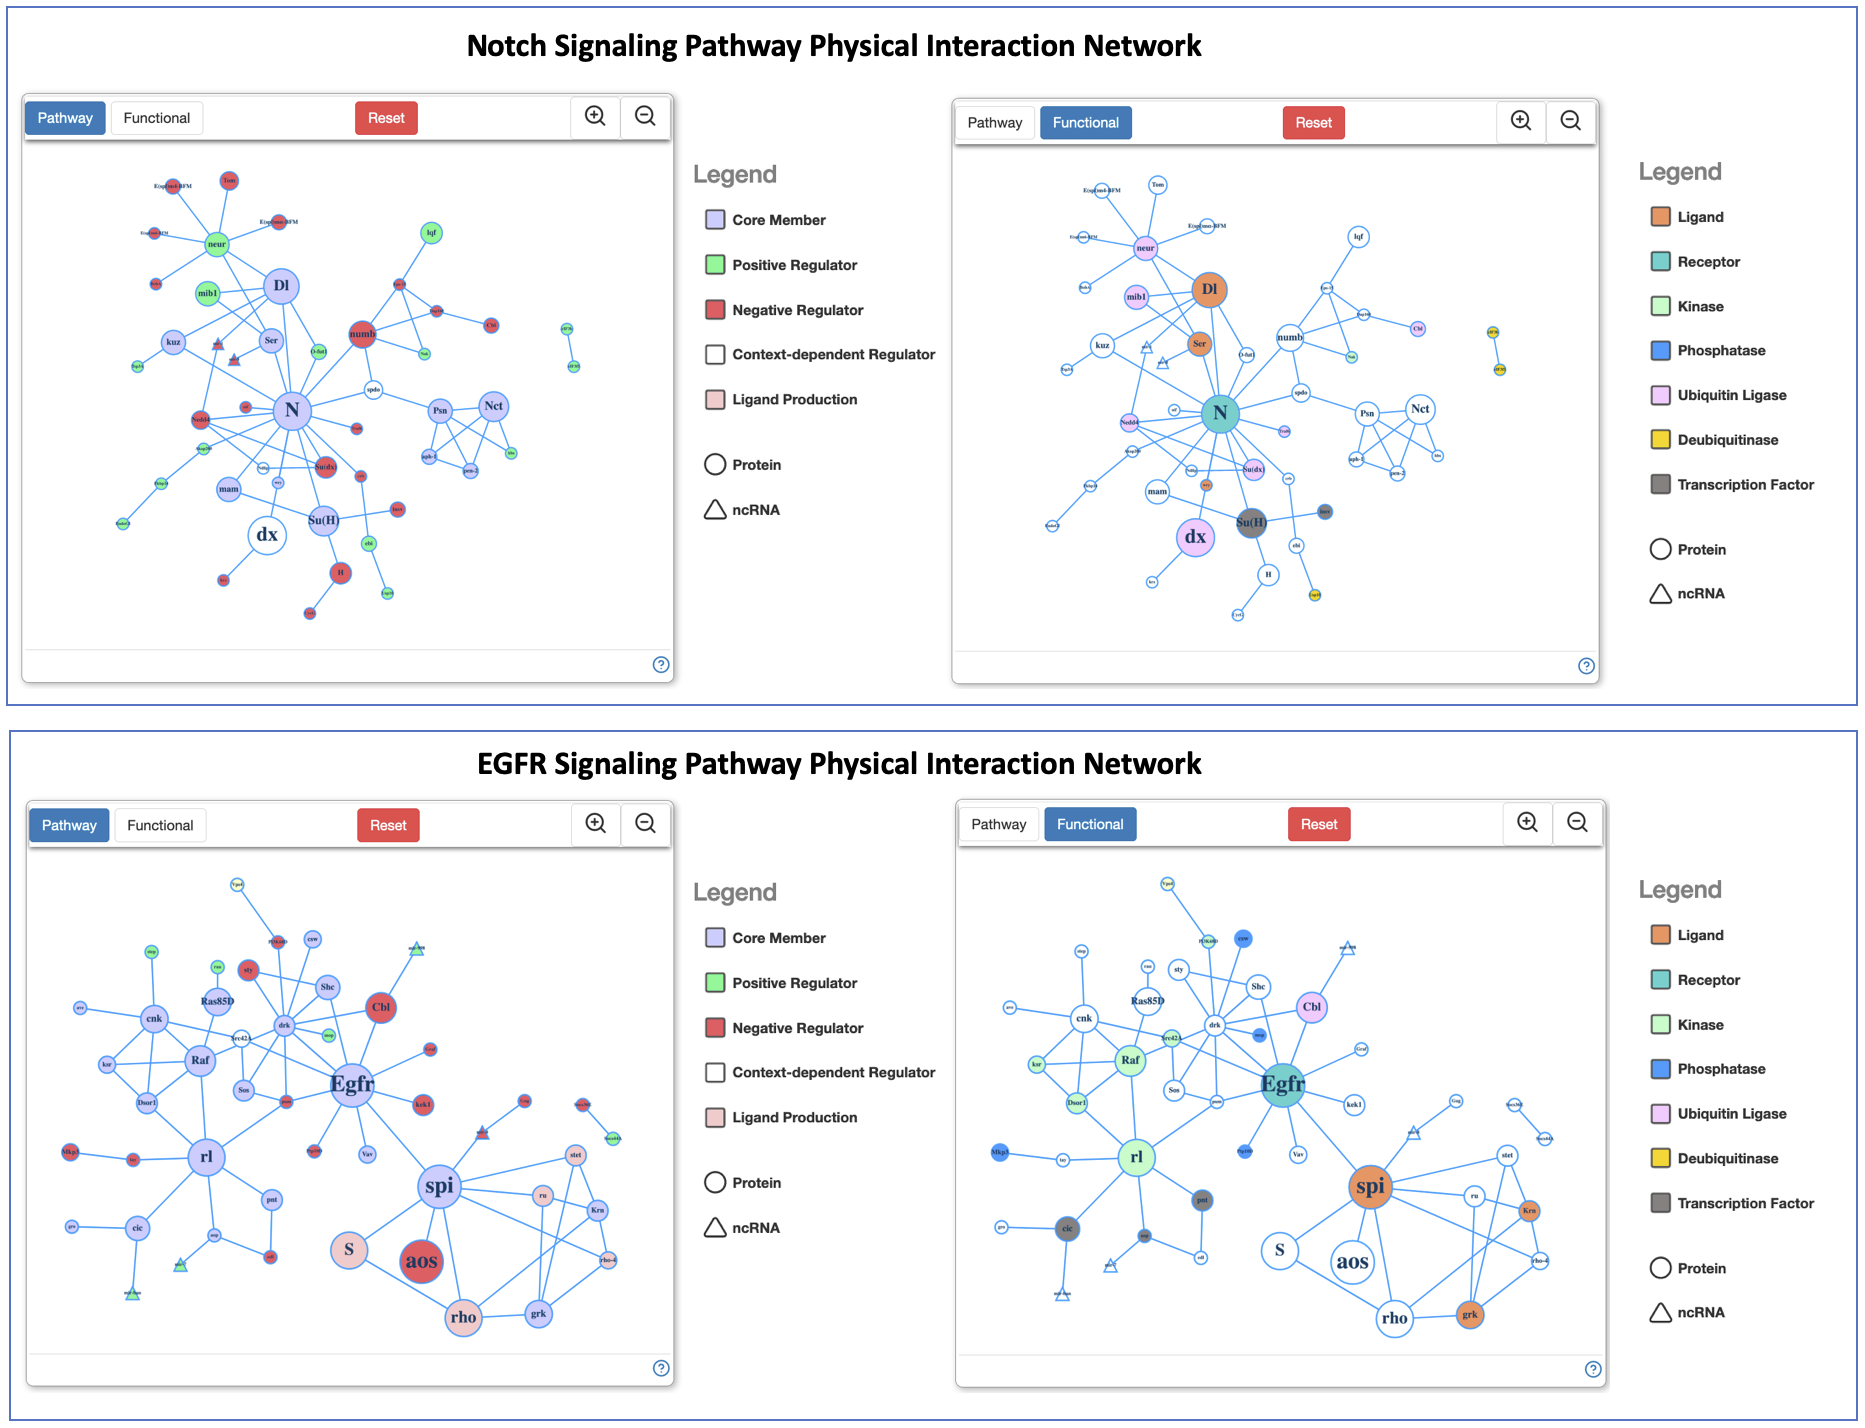
FlyBase has added interactive network diagrams to top-level pathway reports. The networks are generated using experimental data - node size is based on the number of research papers that have been annotated as demonstrating the gene's pathway membership and the connections between nodes are derived from physical interaction data. The networks are interactive - 2 viewing options are available: a pathway view, which distinguishes regulatory interactors, and a functional view, which colors nodes depending on the functional class of the gene product. Network layout can be changed by clicking the 'Reset' button or clicking and dragging individual nodes.